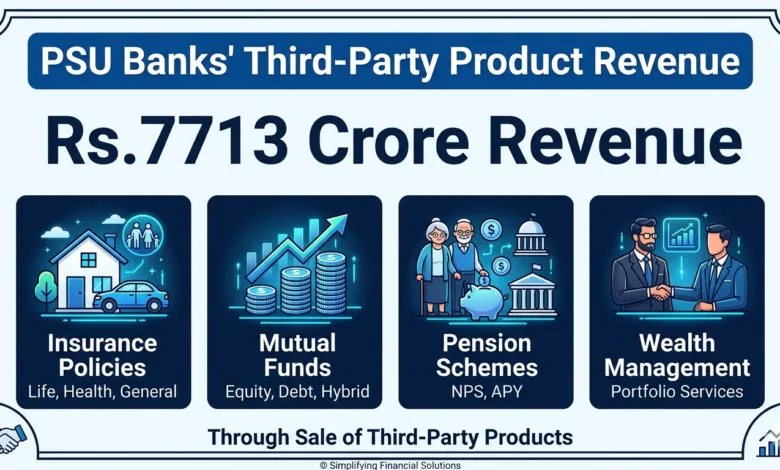
Did You Know? Public Sector Banks earned Rs.7713 crore revenue through sale of Third-Party Products in FY 2024-25. Yes, you read it right. Amongst all the government banks, SBI earned the maximum revenue of Rs.4,522.92 crore. The bank wise revenue is given below.
💰 Explainer: How PSU Banks Earned ₹7,713 Crore by Selling Third-Party Products
Public Sector Banks (PSU Banks) in India earned around ₹7,713 crore by selling third-party financial products. These are products created by other companies such as insurance firms or mutual fund houses but sold to customers through banks.
📌 What Are Third-Party Products?
Third-party products are financial services that banks do not manufacture themselves but sell on behalf of other financial institutions. Banks act as a distributor or agent and earn commission or service fees for every product sold.
- Life Insurance Policies
- Health Insurance Plans
- General Insurance (motor, travel, home)
- Mutual Funds
- Pension and Retirement Plans
- Credit Cards issued by partner companies
- Investment and Wealth Management Products
- Gold Bonds and Government investment schemes
- Banks earn commission income without taking lending risk
- Helps banks increase non-interest income
- Customers can access many financial products in one place
- Improves customer relationship and cross-selling opportunities
Many PSU banks partner with insurance and investment companies. For example:
- Banks selling life insurance policies of insurance companies
- Distribution of mutual funds from asset management companies
- Motor and health insurance sold through bank branches
Income from third-party product sales helps banks diversify revenue. Instead of relying only on loan interest, banks earn money through commissions, advisory services, and product distribution. This is becoming an increasingly important source of income for PSU banks in India.
Revenue earned by PSU Banks in 2024-25 through sale of Third Party Products
| S.no. | Bank | FY 2024-25 (Rs. cr) |
| 1 | Bank of Baroda | 508.75 |
| 2 | Bank of India | 308.41 |
| 3 | Bank of Maharashtra | 51.63 |
| 4 | Canara Bank | 542.50 |
| 5 | Central Bank of India | 144.59 |
| 6 | Indian Bank | 180.58 |
| 7 | Indian Overseas Bank | 49.01 |
| 8 | Punjab National Bank | 746.26 |
| 9 | Punjab & Sind Bank | 27.65 |
| 10 | UCO Bank | 66.62 |
| 11 | Union Bank of India | 564.60 |
| 12 | State Bank of India | 4,522.92 |
Previous Year Revenue of Banks
| S.no. | Bank | FY 2020-21 | FY 2021-22 | FY 2022-23 | FY 2023-24 |
| 1 | Bank of Baroda | 206.42 | 301.18 | 395.66 | 492.51 |
| 2 | Bank of India | 149.30 | 158.04 | 208.26 | 228.90 |
| 3 | Bank of Maharashtra | 23.08 | 31.87 | 36.28 | 41.96 |
| 4 | Canara Bank | 290.82 | 356.34 | 425.78 | 444.10 |
| 5 | Central Bank of India | 65.50 | 80.01 | 97.29 | 135.51 |
| 6 | Indian Bank | 63.98 | 85.01 | 136.35 | 163.21 |
| 7 | Indian Overseas Bank | 32.46 | 33.50 | 42.88 | 45.13 |
| 8 | Punjab National Bank | 456.57 | 497.10 | 542.33 | 623.28 |
| 9 | Punjab & Sind Bank | 10.95 | 26.00 | 22.29 | 27.26 |
| 10 | UCO Bank | 16.57 | 27.03 | 55.76 | 68.11 |
| 11 | Union Bank of India | 243.05 | 279.75 | 357.85 | 387.44 |
| 12 | State Bank of India | 2,168.80 | 2,858.12 | 3,622.96 | 3,870.69 |